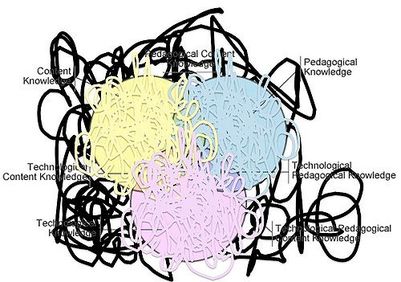
 When I searched for my visual for this posting, this one instantly caught my eye. That’s my thought process! I had never even heard of TPACK before I started this master’s program and so I was initially overwhelmed by all of the tech tools available to teachers now. I am admittedly a bit of a Ludite and I never really felt compelled to keep up with technology because of the rapid pace of change. Now I see that keeping up isn’t the point (and is actually impossible!), but technology changes how and what we teach. Previously, I was satisfied with the tech that my students were using everyday during their 20 minute software rotation in Read 180 because each student was receiving individualized reading instruction during that time block. I would throw out a YouTube video now and then to spice things up, play student recordings weekly and email them to parents so I thought I was pretty cool.
Then came...THE PROJECT. Yikes- how am I going to be innovative? I have always been a strong advocate of goal setting with my students so I knew I was going to have to somehow incorporate this idea digitally. Taking my inspiration from Baggio- how can a tech tool help my students actually visualize their reading improvement and progress toward their goals? I got closer to this point once I found the site Kids Can Graph which allows students to enter in their scores and produce a bar graph which can be printed or electronically shared with their teacher/parents, etc. Great news, but here comes the “wicked” part! How much time is this going to take? Will it actually help my students accomplish their objective which is to make 2 years of reading growth in 1 year because my students are constantly playing “catch up” ? I am excited about the possibility of using this tool to also help parents “see” their child’s progress and start conversations with their child, but I also then have the equity dilemma for families without internet access. I can print out their charts and send them home, but is this creating double work for me? I am anxious to get my prototype into the reality phase so I can hopefully troubleshoot any unexpected glitches. Trying to embrace this messy, complicated process!
5 Comments
 Reflect on the following: What tools did you choose and why?; What worked and what didn’t?; Exploration of classroom use and application; What are barriers to your use, or student use?; How can video be used as an assessment tool?
I chose to explore the tools Screencast-o-matic and EdPuzzle. I often use YouTube videos with my 3rd grade System 44 class since teaching phonics to older kids can be tricky business. They are older and so many of the beginning phonics lessons that they need are geared toward K/1st grade age and seem babyish. I always sing along with my students, but I had never thought of making a screencast with a voice over of an existing video. After I got over my initial horrifying shock at hearing my singing voice, I think the video was improved because I was able to slow down the pace of the song and emphasize those sections that I thought were most important. Every Friday ("Fluency Friday"), I play the recordings of 2 students reading their paragraphs from that week and the class rates their fluency. I also email the recordings to their parents so they can get kudos from their families as well. Since this is already a built in feature of System 44, I don't think I would have my students use Screencast-o-matic . I considered using it for my older students, but I think they need practice with presenting in front of a "live studio audience" because they need to learn about projecting their voices, making eye contact, avoiding those dreaded "umm's" etc. I played around with EdPuzzle and I love it! I primarily use YouTube as a video search engine, but it was great to see all of the other options for videos on this site. I found a new site "Crash Course" that I will definitely be using as a parent. I can see that this site could be very useful for high school teachers who can assign videos with built in quizzes along the way. It seemed very intuitive and relatively simple to modify existing video sources. My primary criteria when I look for a new tech tool is the level of user-friendliness. If I can't figure it out in a few minutes, then I wouldn't want my students to use it because then it becomes an exercise in madness. I can't afford to lose my sanity just yet!  Continue building a bridge between your practice, your action research and what you are learning. Muse about anything that inspires you, observations, reflections, experiences, connections, dilemmas....what’s innovative about what you’re planning to do this semester? How are you thinking “outside the box”?
In my action research last semester, my driving question sought to find the correlation between student self-perception and actual reading achievement. My biggest takeaway was that students in intensive reading interventions need more frequent feedback. My goal this semester has been to find a digital tool that will allow students to enter in all of their monthly reading scores from several different assessments which will produce a visual for them to print out so they can see their own progress (or lack of progress) . I connected Crazy Eddie’s video “Smart Failure from a Fast Changing World” with my DQ when he said that learning stays flat when the “pace of change overtakes the pace of learning.” My students sometimes made such amazing reading gains, but they just can’t see it. When I did a Google search for the key terms “visual” “reading” “progress”, it led me to many paper/pencil charts that can be used to help kids track their progress. Lots of cutesy Pinterest pictures, but not what I was looking for. When I added the search terms “digital” and “survey” all of the cutesy images disappeared, but I was left with results that didn’t match what I was looking for. I was inspired by Baggio’s urging to create clean and simple visuals. “Don’t Make Me Think” (pg 156) seems counterintuitive to teachers, but the point is that we can only think one thought at a time so we need to reduce their cognitive load by keeping the visuals clear. I think I am on a quasi-innovative track with trying to create a digital tool for students since my search came up with very few hits. I did stumble upon a math graphing site for kids called “Kids Create a Graph” that I am very excited about playing around with. It easily helps them create a bar graph, but I also wanted a survey that would capture their written reflections about their current monthly reading data and what their next steps are. Can I easily combine these 2 aspects somehow? I am also considering John Hattie’s Visible Learning for Teachers which shows that “Educating students to have high, challenging, appropriate expectations is among the most powerful influence in enhancing student achievement”. This concept of “personal bests” in goal setting has always been important to me to share with my students. Lots of ideas swirling around right now- just trying to get focused and clear!  “How can infographics be used in your classroom?”
After looking at the different resources and examples of infographics, I absolutely see the applications for both middle and high school students. It is a creative assessment tool that allows students to present large amounts of information in a visual way. Many of the examples I saw were quite complex so I would be interested to see examples created by younger students. Based on my own experience with learning how to navigate piktochart, I would say that this would be very difficult to teach my 4th/5th grade students how to use. These sites that I researched seemed very time consuming to master and I don’t see these specific tools as the best use of my ELA 90 minute daily block. I do however think that the mind mapping tool “Popplet” that my students learned how to use earlier in the year could definitely be used to create an interesting infographic. Students used this tool to write a concise phrase and then search for an image that they and their partner believed was the best representation. Now that I know about Creative Commons, I would definitely use that as an opportunity to show students how to choose images that are publicly shared. After they created their visual with limited text, students projected their Popplets on the whiteboard and used it as the foundation for their oral presentations. I was extremely impressed by their oral presentations because they referred to their visuals, but they didn’t have a full speech/text in front of them which allowed them to really focus on maintaining eye contact, using public speaking voice, etc. I had them orally present with partners so they were able to elaborate and build on each others ideas. During their rehearsal time I noticed that many pairs were simply describing the image they picked and basically “reading” the image. Once I asked them to explain why they chose that image, their explanations became much more profound and interesting. |
Dana HandI teach Read 180 at Northwood Elementary School and I am passionate about reading (obviously!) In my "free time" I love hanging out with my 2 teenagers and taking our two dogs for long walks. Archives
March 2017
Categories |
 RSS Feed
