 Continue to explore how you have changed as an educator and how you can develop your leadership capacity to share with others.
I think one of the most significant ways that I have changed during this Master’s program is that ironically, I no longer feel that I need to master a new tool before I share it with my students or even my colleagues. I think it is just as valuable to be enthusiastic and positive about using technology with students and fellow teachers instead of being seen as an “expert” (which I most definitely am not!- Just trying to move myself up the SAMR steps). Just modeling troubleshooting and playing around/experimenting with the features of a new tool gives everyone permission to learn together. Given that I teach at a small site with only two teachers per grade level, it is very exciting that Jenny and I share the same mindset. We are both on the AVID team together which seems like an ideal place to be able to infuse technology standards. I also meet weekly with both the principal and Academic Specialist to help plan professional development so I am planning on furthering our exploration of John Hattie and his “biggest bang for the buck” best teaching practices. I am excited to help make our amazing school even more amazing!
3 Comments
 Part 1: Reflect on your process of building your website in terms of design, putting content and what you can now do…
Part 2: How can you take what you’ve learned from this master’s program out into the world and into your classroom immediately? Part 3: Finally, how do you plan to use what you’ve learning from this program in the future? Part 1- Building the website turned out to be a far bigger challenge than I first expected. Throughout the course of this year I had the vision that we would essentially be dropping our already completed work into a basic template and just sprucing it up a bit. Wrong! I have had several mini panic attacks along the way when I realized the scope of this project. It was very helpful to have the “What Goes Where” document as a guide otherwise I think I might have made a complete mess of the entire website. The design features of Weebly took quite a long time to figure out and I am still not completely happy with the look of all of my pages, but I have to accept that it is good enough. My current challenge as I am wrapping up my pages is to make sure that they are visually appealing while still covering the necessary content. It feels really exciting to see the end in sight! Part 2- Stepping into the student role after many years has helped me renew my appreciation of what my struggling readers face on a daily basis. Ever since the first day of school, I enlisted the support of my students and let them know that I could feel their pain of having to do homework and feeling like there wasn’t enough time in the day to get it all done. I am definitely not as intimidated by technology anymore and I no longer feel that I need to master a tool before I use it with my class. Not being afraid to fail is definitely a lifelong lesson that I will carry with me and hopefully model for my future students in years to come. Part 3- Since it took me almost a year to turn my concept into reality, I have only gotten to use my digital graph/feedback questions twice so far with my students. I can’t wait to study the results and potential impact of this tool once students use it more frequently. Now that my tools are complete, I am ready to share them with my colleagues. I am anxious to see how this tool might be adapted for primary grades and how user friendly it is for teachers with varying technical abilities. Ultimately I would like to like to help support our entire staff with professional development opportunities where we have time together to play around with new tech tools, try them out with our students, and report back to each other about our successes and struggles just like we did every week in this program. "I'm not there yet, but I am closer than I was yesterday."  Disclaimer- This is not me, but definitely on my bucket list! I am finally feeling more comfortable with using Weebly now that it is functioning properly for me. Now that I have the technical aspects more under control, I am starting to dive into the content. I have my home page, About the Author and Inspiration pages pretty close to done, but I am struggling with how to organize my Learn More pages. The checklist was very useful on the other pages, but my current feeling is that there is way too much content on the first Learn More page. My overall struggle is visually how to keep each page appealing/clean/easy to read while at the same time including all of the many required content pieces. My actual project has evolved into touching on 3 main areas (Growth Mindset, creating visual data charts and providing effective feedback). I am wondering if I can ask Marie to make me 3 separate pages or if that is just creating more work for myself which I definitely don’t need at this point? I am at a bit of a stand still right now so I just need to dive in and get going. Maybe once I start adding some content to those pages, I will see a solution. I used to be a definite planner, but one thing this Master’s journey has taught me is that sometimes the only way to figure something out is just jump into the deep end and have the confidence in myself that I won’t drown!
OK folks. It’s official. My video is out there for the world to see (or not see which is probably more likely!) . My son helped me to upload it to YouTube which would have been a bit confusing without his help. I didn’t know that YouTube had it’s own video editing section so I was able to do some final video and audio touches. There was a button called “Quick Fixes” or something like that so I didn’t really have to manually change too much. I was frustrated that it only had 3 thumbnails for me to choose from and 2 of them were photos of me in frozen bizarre facial expressions. There was only a custom thumbnail option if you become verified, but I’m OK with how it is now. It’s just a relief to finally have this finished- it was definitely a time consuming project! I am not 100% proud of my final product, but it’s another milestone that I am proud that I accomplished.
 Give us an honest appraisal (venting?) of your next journey steps around trying to produce your Capstone Project video. What problems did you encounter? How did you solve them?
I decided to just run with using iMovie since it seemed the most intuitive and time efficient. Overall, I am pleased with the look of my video although keeping it to 90 seconds was definitely a challenge! The video aspect was relatively straightforward, but I had to enlist my teenagers to help me with the audio portion. The background music often overlapped and I wasn’t able to readjust the size of the audio bar. I looked at the help features on iMovie which helped, but it was still was a bit tricky. I don’t have an iCloud account so that also presented challenges because then my audio choices were very limited. I decided to just play around with the speed of the preloaded audio. It’s not exactly what I wanted, but it’s good enough I hope. Once I uploaded it to my Drive, I realized that the opening shot isn’t my beginning photo, but instead it’s me frozen in a weird facial expression. Awesome- hope I can get some help fixing that... I haven’t tried to upload it to a YouTube channel and since I've never tried it, I’m not sure how that will go. I figure all those millions of YouTubers did it so I can too!  What does being a good critical friend mean to you? What do you expect or would you like from others?
A Critical Friend is someone who: • first and foremost, you trust and respect their viewpoint • provides honest and critical feedback • is a skilled observer and listener • asks provocative and stretch questions • understands your background and context of your project • provides a different perspective through fresh eyes My expectations from others:
 Give us an honest appraisal (venting?) of your journey around trying to produce your Capstone Project video. How did you decide what editor you might use? What problems did you encounter? How did you solve them?
While I am just beginning my journey of attempting to produce my video, I can already see that this 90 second video is going to take more time to create than I originally thought. My only experience with my own students is creating an iMovie trailer when we wrote our own class play. While that was relatively painless and intuitive, I guess I assumed making this video would be as well. Wrong! I watched the tutorials for WeVideo and Moovly and they both seemed very complicated to me. I plan on trying iMovie, but since I am still in the storyboard phase, I don’t know what challenges and struggles await. YouTube Editor might be a possibility as well. I know the tone of my video is going to be slower paced and so far I haven’t really seen any examples of capstone project videos that have inspired me. I don’t want a lot of flashy special effects so I really want the images I choose to be powerful and I want my message to be clear. I am hoping to create an emotional story that really communicates the challenges that my struggling readers encounter everyday. Jane advised me to have about 30 seconds showcasing the bleak future that non-readers face and transition the final 60 seconds into a more hopeful/inspiration tone when my project idea comes in and saves the world! My current struggle is just in getting started with the script. Trying to pull the viewers in and encourage them to find out more about my project is going to be tricky, but I am just going to jump into it  As a member of this Master’s program, you are helping shape the future of your school with regards to its 21st Century technology practices. Please research what your school’s educational technology mission statement is. Is there one? Is technology mentioned at all?
In your blog, please write your school’s mission statement that incorporates technology and comment on it. How does their statement align with your personal practice? Does it meet the goals for your capstone? At the start of the school year, our staff created a “Top Down” collaborative vision. It started with our district’s mission statement and worked down to our site level. District Mission Statement "Our mission is to transform lives by instilling 21st century skills and to inspire lifelong learning in every student." District Goals "Goal 1: Students will graduate career and college ready through inquiry-based learning experiences and assessments aligned to 6C/California State Standards Goal 2: Students will have equitable access and opportunities to close the achievement gap. Goal 3: Instill 21st Century Skills - All students will master 21st Century Learning." AVID Schoolwide Mission Statement (We are an AVID Elementary School) "AVID’s mission is to close the achievement gap by preparing all students for college readiness and success in a global society." We then described our AVID site goals which are based on AVID strategies of writing to learn, inquiry, collaboration, organization and reading to learn. Last but not least, we created our own mission statement. Northwood Mission Statement "Our mission is to foster a love of learning by challenging and supporting every student, fostering collaboration among all stakeholders (students, staff, families & community), and maintaining a positive and respectful environment." In reviewing our school’s mission statement, there is no explicit mention of technology. While this mission statement is in alignment with my educational philosophy of supporting every student, it does leave out a key piece of our innovative learning program. Although “21st Century” skills are mentioned in our district’s goals, that too is up to interpretation as to exactly what hat means. I think that a simple addition to our mission statement such as “ while improving equity of access and supporting best practices in technology integration” might be a way to demonstrate our school’s vision and commitment.  Write a blog review of the Add-ons you chose and what hurdles you encountered and your overall experience.
Creating a Google Survey was a relatively new experience for me so the learning curve on that was steep for me before I even began looking into Add-ons. It really made me aware that foundations really need to be strong before we ask students to stretch to the next level! I chose to create a survey for my entire staff seeking feedback about my digital graphing tool project. I plan to use their responses to really help me narrow in on who my audience will be (either K-5 or just 3rd-5th). I struggled with which type of question (linear scale, multiple choice, short answer, etc.) would give me the best feedback while at the same time trying to respect the amount of time it would take to complete the survey. I wanted the greatest possible number of teacher responses as possible so I wrote in my header that it would take 3 minutes to complete. ADD-ONS USED:
2. Doc Appender I thought I would like this Add-On more than I did. While I did like viewing the responses in a Google Doc vs. Sheets, it didn’t have the same visual impact for me as Advanced Summary. Since I am so inexperienced with Google Forms, it is hard for me to see the usefulness of this tool right now. Maybe as I become more proficient, I will be able to see a better use for this add-on. 3. Form Publisher I didn’t realize at the time that this Add-On is very similar to Doc Appender and so my inbox was flooded with Templates every time a teacher responded to my survey. I am still not quite sure about the purpose of these templates and it wasn’t quickly intuitive for me so I didn’t explore it too much. Once I found Advanced Summary, everything else seemed irrelevant to me because it is exactly what I wanted!  Having explored several capstone websites, write a blog about who you think the audience of your capstone is going to be and why. Also, what content do you think you will need to have on your website in order to engage and teach them about your research.
Reviewing the finished products of other capstone websites was very helpful to me and helped me consider which elements were the most useful to me. My audience is going to be elementary school teachers, but evaluating Ann Dearborn’s project made me question whether if even that is too broad. My research project and DQ are geared toward upper elementary teachers (grades 3-5). I initially wanted to design a site that would be especially helpful for my fellow Read 180 teachers (grades 3-5) because it is focuses on using some student data points that are unique to that program. While some of my tools are adaptable to younger grades, the type of data analysis/feedback conversations are really more appropriate for slightly older students. The content that was most engaging to me from the websites I viewed were the practical “ready to use” features. For example, video tutorial links on how to use a certain digital tool, printable kid friendly rubrics, and easy to find links that led directly to recommended resources. I appreciated Ann Dearborn’s preview feature to her links (with the chain graphic) so that you didn’t have to click in deeper. Having the most information at the top was useful because sometimes users don’t take the time to scroll down the page and might miss something. I really do want my content to be clear, concise and a practical how-to toolkit. I guess that comes from my years of teaching struggling readers!  What has been or now is your experience with Google Forms? Is it intuitive? What challenges did you encounter when building your form? Do you think this tool would be beneficial for your teaching practice?
I have only used Google Forms a handful of times when I was seeking feedback from our staff following a few professional development mini-trainings that I led. It was very intuitive and I liked the variety of response options such as multiple choice, scaled ratings, and short answer. I never had any official training to produce my survey so it couldn’t have been too tricky! I don’t remember encountering any challenges with building the form, but it was a bit frustrating to not know when someone had replied to the survey unless I checked the spreadsheet. I hadn’t previously thought about how to use Forms with students, but I am very excited after reading the article “The NEW Google Forms: 9 Classroom Uses.” I learned about a Google Add-On feature (which is also new to me) called Awesome Table. I played around with it a bit and I am still not completely clear if it is user friendly enough for me to use with my elementary students. One feature I especially want to find out more about is how it takes the responses and creates colorful graphs/pie charts. This ties in perfectly with my driving question about how to help students visualize their monthly reading progress. I plan on reaching out to our district technology guru and hopefully getting his take on if this might be a useful tool for me. Stay tuned!  What hopes/thoughts do you have on how fellow cohort members can support you with completing your capstone and how you can support them? How will you work to support positive cohesion among your cohort?
I am very excited to have the support of my cohort as we near the finish line of our capstone projects. Being held accountable every week to my fellow colleagues has really helped me to put forth my best effort throughout this educational journey. I look forward to the “critical friends” aspect of providing constructive feedback. I know that I always benefit from stepping back and seeing my work through another set of eyes, and hopefully I can help others improve upon their projects as well. I think the diversity of teachers and grade levels in our cohort will enhance everyone’s final results since we all have our unique talents, backgrounds and lenses. Often just one simple “I wonder…” from another teacher is enough to accelerate our own learning. I have no worries that our cohort will continue to work positively with each other since this truly is a special group of people. Time constraints do force us to use our time wisely so I hope that we will all be able to keep up with our own project deadlines so that we have the opportunity to meaningful support one another.  How have you evolved as an innovative thinker?
To be honest, I still do not completely identify with the term “innovative thinker”. I have definitely grown as an educator and my digital toolbox has increased tenfold, but I don’t know if I am innovative yet. Miriam Webster’s Dictionary defines innovation as “a new idea, device or method”. In my mind “innovative” is a high compliment that signifies a truly impactful change. I think part of my hesitancy in connecting with this term is that I haven’t yet seen an impactful change in my students. I am extremely excited about using my digital feedback tool and teacher/student conference form (still designing that piece), but I still don’t know if my new tool is going to “cut the mustard” as my grandma used to say. This course has forced me to think metacognitively almost every week since many of the concepts were are learning are abstract, deep and unfamiliar to me. At more than one point this semester, I have thought to myself “This is what my struggling readers must experience everyday!”. I had to reread the articles several times and even then, I felt like I was only to grasp a few of the most important concepts. Learning to struggle and giving myself permission to not understand all the material has helped me to become a better learner. The Why-How ladder was very useful in helping me to choose specific words that would encapsulate my driving question. Using a mind map to create my prototype was also valuable to me because I actually used the digital tool Popplet to help me think through my ideas instead of just creating a final product. Perhaps the most relevant part of this course was my book review choice of John Hattie’s Visible Learning for Teachers. His expansive scientific research study synthesized what actually works and doesn’t work in education. His emphasis on the high impact strategy of providing effective feedback and the specific questions that push students to reflect, helped to shape my final capstone project. I now want to include an monthly individual teacher/student feedback time to discuss “Where am I going?”, “How am I going there?” and “Where to next?” I’m fairly certain I know where I am going, less sure of how I am getting there, but where to next is yet to be discovered! Maybe it’s innovative thinking...  https://cdn.pixabay.com/photo/2015/01/08/18/24/children-593313_960_720.jpg This week you are asked to blog about how you incorporate gaming, gamification, game thinking, or design thinking into your class. How? What are your objectives?
Since I teach Read 180, gamification strategies have always been a part of my class because the students use R180 software everyday. When they first log in to their home screen, their “news feed” shows them their latest streaks and achievements. I have always appreciated and celebrated these streaks because they are based on actual reading achievement and are not artificial badges that I have seen on some other sites. I also think the concept of “leveling up” is very motivating for kids and is a great visual way for them to see their progress. Introducing challenges where failure is expected and even necessary really encourages even my quietest students to join in. I think back to some of my favorite teachers who made learning so fun simply because of their enthusiasm. Even the most boring worksheet was fun because we got to use a highlighter or smelly marker. Anytime teachers can make learning fun, whether through a digital tool or old school competitions, kids benefit. I was inspired by one of the TED speakers to learn more about the online games that kids use today because our generation is more out of touch than any other generation before us. This seemed surprising to me, but it rang true since I have 2 teenagers who are growing up in a world that is very different from the one I lived in. I decided to create an account on Clash Royale since my 16 year son old just reached Legendary status- whoa, right? He has been working for over a year on this accomplishment and regularly told me about different arenas/spells/hog riders/treasurechests/barbarians/goblinhuts/gems/knights/princes/archers/witches/muskateers/minion hoardes/hidden teslas/ and the list goes on and on...I always feigned interest and told him “Great Job!”, but once I experienced the many challenges I faced as a newbie in the game I gained a greater appreciation for his success. The roles are now reversed because I am seeking his advice about which cards I should put in my Battle Deck and should I upgrade my Valkyrie? (Pretty nerdy, but actually fun!) I try to think metacognitively about this game and why it is so addicting (incentives to log in every 3 hours, rewards for partial accomplishments, social teams that support each other and have “friendly battles”, different levels and opportunities that only unlock at higher levels). My struggle now is how to use some of these same concepts in my project? I hadn’t considered it before I began my prototype so I am wondering how I might leverage this idea? 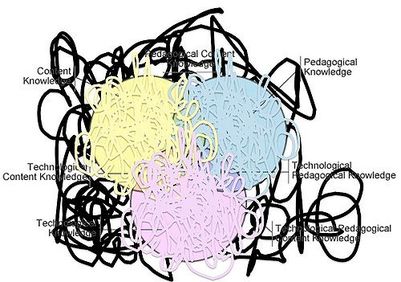 When I searched for my visual for this posting, this one instantly caught my eye. That’s my thought process! I had never even heard of TPACK before I started this master’s program and so I was initially overwhelmed by all of the tech tools available to teachers now. I am admittedly a bit of a Ludite and I never really felt compelled to keep up with technology because of the rapid pace of change. Now I see that keeping up isn’t the point (and is actually impossible!), but technology changes how and what we teach. Previously, I was satisfied with the tech that my students were using everyday during their 20 minute software rotation in Read 180 because each student was receiving individualized reading instruction during that time block. I would throw out a YouTube video now and then to spice things up, play student recordings weekly and email them to parents so I thought I was pretty cool.
Then came...THE PROJECT. Yikes- how am I going to be innovative? I have always been a strong advocate of goal setting with my students so I knew I was going to have to somehow incorporate this idea digitally. Taking my inspiration from Baggio- how can a tech tool help my students actually visualize their reading improvement and progress toward their goals? I got closer to this point once I found the site Kids Can Graph which allows students to enter in their scores and produce a bar graph which can be printed or electronically shared with their teacher/parents, etc. Great news, but here comes the “wicked” part! How much time is this going to take? Will it actually help my students accomplish their objective which is to make 2 years of reading growth in 1 year because my students are constantly playing “catch up” ? I am excited about the possibility of using this tool to also help parents “see” their child’s progress and start conversations with their child, but I also then have the equity dilemma for families without internet access. I can print out their charts and send them home, but is this creating double work for me? I am anxious to get my prototype into the reality phase so I can hopefully troubleshoot any unexpected glitches. Trying to embrace this messy, complicated process!  Reflect on the following: What tools did you choose and why?; What worked and what didn’t?; Exploration of classroom use and application; What are barriers to your use, or student use?; How can video be used as an assessment tool?
I chose to explore the tools Screencast-o-matic and EdPuzzle. I often use YouTube videos with my 3rd grade System 44 class since teaching phonics to older kids can be tricky business. They are older and so many of the beginning phonics lessons that they need are geared toward K/1st grade age and seem babyish. I always sing along with my students, but I had never thought of making a screencast with a voice over of an existing video. After I got over my initial horrifying shock at hearing my singing voice, I think the video was improved because I was able to slow down the pace of the song and emphasize those sections that I thought were most important. Every Friday ("Fluency Friday"), I play the recordings of 2 students reading their paragraphs from that week and the class rates their fluency. I also email the recordings to their parents so they can get kudos from their families as well. Since this is already a built in feature of System 44, I don't think I would have my students use Screencast-o-matic . I considered using it for my older students, but I think they need practice with presenting in front of a "live studio audience" because they need to learn about projecting their voices, making eye contact, avoiding those dreaded "umm's" etc. I played around with EdPuzzle and I love it! I primarily use YouTube as a video search engine, but it was great to see all of the other options for videos on this site. I found a new site "Crash Course" that I will definitely be using as a parent. I can see that this site could be very useful for high school teachers who can assign videos with built in quizzes along the way. It seemed very intuitive and relatively simple to modify existing video sources. My primary criteria when I look for a new tech tool is the level of user-friendliness. If I can't figure it out in a few minutes, then I wouldn't want my students to use it because then it becomes an exercise in madness. I can't afford to lose my sanity just yet!  Continue building a bridge between your practice, your action research and what you are learning. Muse about anything that inspires you, observations, reflections, experiences, connections, dilemmas....what’s innovative about what you’re planning to do this semester? How are you thinking “outside the box”?
In my action research last semester, my driving question sought to find the correlation between student self-perception and actual reading achievement. My biggest takeaway was that students in intensive reading interventions need more frequent feedback. My goal this semester has been to find a digital tool that will allow students to enter in all of their monthly reading scores from several different assessments which will produce a visual for them to print out so they can see their own progress (or lack of progress) . I connected Crazy Eddie’s video “Smart Failure from a Fast Changing World” with my DQ when he said that learning stays flat when the “pace of change overtakes the pace of learning.” My students sometimes made such amazing reading gains, but they just can’t see it. When I did a Google search for the key terms “visual” “reading” “progress”, it led me to many paper/pencil charts that can be used to help kids track their progress. Lots of cutesy Pinterest pictures, but not what I was looking for. When I added the search terms “digital” and “survey” all of the cutesy images disappeared, but I was left with results that didn’t match what I was looking for. I was inspired by Baggio’s urging to create clean and simple visuals. “Don’t Make Me Think” (pg 156) seems counterintuitive to teachers, but the point is that we can only think one thought at a time so we need to reduce their cognitive load by keeping the visuals clear. I think I am on a quasi-innovative track with trying to create a digital tool for students since my search came up with very few hits. I did stumble upon a math graphing site for kids called “Kids Create a Graph” that I am very excited about playing around with. It easily helps them create a bar graph, but I also wanted a survey that would capture their written reflections about their current monthly reading data and what their next steps are. Can I easily combine these 2 aspects somehow? I am also considering John Hattie’s Visible Learning for Teachers which shows that “Educating students to have high, challenging, appropriate expectations is among the most powerful influence in enhancing student achievement”. This concept of “personal bests” in goal setting has always been important to me to share with my students. Lots of ideas swirling around right now- just trying to get focused and clear!  “How can infographics be used in your classroom?”
After looking at the different resources and examples of infographics, I absolutely see the applications for both middle and high school students. It is a creative assessment tool that allows students to present large amounts of information in a visual way. Many of the examples I saw were quite complex so I would be interested to see examples created by younger students. Based on my own experience with learning how to navigate piktochart, I would say that this would be very difficult to teach my 4th/5th grade students how to use. These sites that I researched seemed very time consuming to master and I don’t see these specific tools as the best use of my ELA 90 minute daily block. I do however think that the mind mapping tool “Popplet” that my students learned how to use earlier in the year could definitely be used to create an interesting infographic. Students used this tool to write a concise phrase and then search for an image that they and their partner believed was the best representation. Now that I know about Creative Commons, I would definitely use that as an opportunity to show students how to choose images that are publicly shared. After they created their visual with limited text, students projected their Popplets on the whiteboard and used it as the foundation for their oral presentations. I was extremely impressed by their oral presentations because they referred to their visuals, but they didn’t have a full speech/text in front of them which allowed them to really focus on maintaining eye contact, using public speaking voice, etc. I had them orally present with partners so they were able to elaborate and build on each others ideas. During their rehearsal time I noticed that many pairs were simply describing the image they picked and basically “reading” the image. Once I asked them to explain why they chose that image, their explanations became much more profound and interesting. 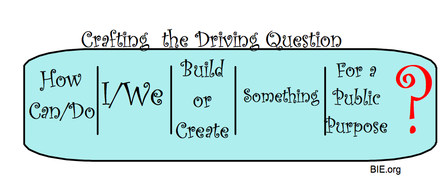 FOCUS: You may consider the elements of ‘SITE’ and the needs of your learners or audience(s). How does SITE apply to you as a learner?
I feel as though my driving question is right within my grasp, but then it slips through my hands. I am interested in finding the right digital tool that will help my students record their monthly reading progress and then hopefully turn it into an infographic that will help them visualize whether or not they achieved their goals. Instead of using just one data point (Reading Inventory) like I used in my action research project, I would like to use multiple quantitative measures (progress on the computer software, # of Reading Counts points, total words read, and comprehension %). I would also a place for students to reflect qualitatively about what specific strategies they used that month that were or weren’t effective for them. Now that I have a slightly better understanding of the SITE model, I wonder if this tool will help my 4th/5th graders form a path to their goal achievement? I have played around with Piktochart, but it definitely wasn’t kid friendly. I hadn’t thought about including the families as part of my audience, but maybe gathering their input in survey form (either digitally or on paper) would help motivate my students as well? I wonder if I can find a very simple way for students to enter their own data and create a visual graph/pie chart, etc so that they can visually see (a la Baggio) their progress month by month, instead of just measuring their reading progress 4 times a year by their lexile level? It is very disheartening for many of my students who continue to score BR (0) for as many as 2 years in a row. Naturally they feel that they are “stuck” when in fact they have made so much progress in many other areas of learning to read. Will seeing their quantitative data in a visual form help them more accurately reflect upon their own learning? Like I said, just when it seems like my final project is beginning to make sense, my list of questions seems to grow exponentially (I thought my math teacher Cohort friends would like that!) 
Miriam Webster defines the word "Luddite" as one who is opposed to especially technological change. I must admit that I was the last person I know to create an email account back in the day and just purchased my first smart phone 2 months ago. Shocking, right? I dig my heels in about technology unless I can see how it can improve my job and personal life. Especially in the past few years, I struggle with how so many people- not just teenagers- are constantly digitally connected and I feel that social media is largely responsible (see cartoon above!) It may seem ironic that I am seeking my Master's degree in Innovative Learning, but I think that my Luddite tendencies help me not to be attracted to the latest shiny tool and using tech with my students just for the sake of using technology with them because it's fun. I absolutely love Pinterest and You Tube for finding teaching resources, but never really thought of those sites as social media. My next challenge is to keep an open mind about how using Twitter might be useful to me in communicating and collaborating with other professionals. At first glance, the site is visually overwhelming to me (needs some help a la Baggio!) and makes me want to log off. Twitter didn't do itself any favors in my eyes when the first message I got from them was about Kanye West. I value my time so immensely that social media posts often leave me thinking, "Who cares?" My first Educhat is scheduled for an hour so my feelings may change about how this may be a useful collaborative tool for me.
2. If I saw an inappropriate post from a student, I believe that Patrick Larkin's idea was spot on about notifying the administration. I really like the idea of projecting a photo with a comment and making the students respond to the prompt "What would you think about me if this is all you knew?" The impact of posting "locker room" talk is absolutely a current event topic that many students can see has real life ramifications. Even though this may be a sensitive political topic, the impact of social media today is absolutely real and cannot be avoided- even to a quasi Luddite like me. 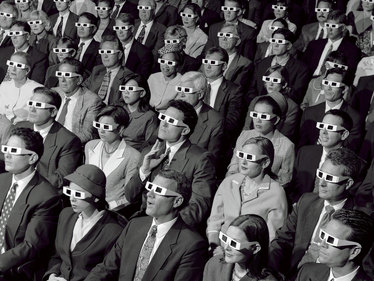 My target audience for my final 2 semesters could be any teacher, but primarily Read 180/System 44 teachers who teach below grade level students in reading (3rd-12th grade). I am still not clear about what resource I can create that will help teachers and students measure their self-perceptions. After reading Dervin, I see that teachers often ask students the wrong questions, but I am unsure about how to ask the "right" ones that will give me the information I need to help students bridge their reading gaps. Baggio highlights the importance of using simple, clear visuals to impact student learning so I am wondering how that might fit into the survey/interview that I create.
I want whatever resource I create to be intuitively user friendly and actually useful in informing both the teacher and student about their current self-perception so that they can use the information to help set specific reading goals. I am unclear about whether I should create a digital tool/survey , an interview/flow chart style or something altogether different? One obvious drawback is that my students reading abilities are very low so any individual reading task is often challenging. On the other hand, individual interviews would be very time consuming for teachers and some students might feel pressured to answer the way they think the teacher wants them to answer. The examples of "reading inventory" style questions I have seen in the past seem very superficial and don't allow the student to self-reflect on challenges/successes. I am hopeful that reading John Hattie's "Visible Learning" might inspire me and help me clarify my capstone project. 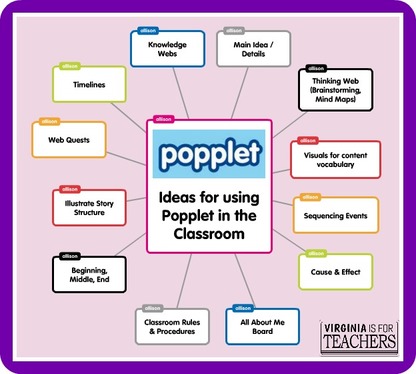 Since I am a Read 180/System 44 teacher, my 4th/5th grade students already use these software programs daily for 30 minutes to improve their reading skills. Since I only have 90 minutes a day with them, I really don't use many other digital tools other than Google Slides for final projects. As a part of my action research, I am teaching my students about Growth Mindset using the Brainiology curriculum. As a culminating project for this unit, students are creating mind maps to show what they have learned. I stumbled upon Popplet when I searched my digital toolbox for "mind mapping". It is available as an app, but I have only begun to use it on the desktops because we don't have as many ipads available. I haven't had extensive use with this yet "in the trenches", but this is what I have found so far.
 Reading Dervin's article "Qualitative Research in Information Management" made me feel like this poor woman in the photo. She put her reading glasses on so she could really focus, but she's still confused. She gathered her informational resource, but she's still confused. She even has a trusty sidekick to guide her in this process, and yet she is still confused. I felt my eyes starting to glaze over when reading the article and I was only on the second page. Maybe I needed a different environment? My quiet room might work. Nope. I found myself skimming the entire article to try figure out the core idea and using the strategies I teach my students- look at the text features like headings, captions, etc but that didn't help much either. After struggling for 7 pages, I finally began to feel frustrated. My notes in the margin say, "What can I take from this reading that can help me and my students?" Unfortunately I still don't really know. My only glimpse at understanding came midway through the article when I saw the stick figure drawing crossing the gap toward help. Hooray!- Dr. Bobbe Baggio must be right that visual representations convey more meaning to most people. After finally reading the six different exemplars, I think Dervin's main point has something to with systems thinking?
If I had to teach this content to high school students, I think I would definitely pull in Baggio's approach and try to visually represent the six different exemplars because those real world examples made more sense to me. I wasn't tripped up on syntax/vocabulary so I was able to focus more on the content. I think if we sketched out each specific example and tried to synthesize the idea into a caption like a series of cartoons, maybe some connections would start to form. I am glad that we were warned that reading this article is "dense" otherwise I think I would have wound up feeling dense! This was only my first reading and I can tell that this will require multiple reads to try and pull out something (anything!) that is meaningful for me..  My first personal step toward being a more responsible digital citizen was in searching for the image I used above. I had never given a second thought to using any image that I found with a basic Google search, but once I was made aware of alternative sites that offer free public use, I will gladly use it in the future. I think the same can be said of the importance of teaching digital communication to my students. Most of my students want to follow our school rules "Be Safe. Be Respectful. Be Responsible. Be a Learner.", but many of them have not thought about how those rules need to be followed online as well.
In creating a lesson plan designed for my 4th and 5th graders to understand the importance of tone in written digital communication, I hope to make this learning more personal for them by focusing on how to convey respect online.
|
Dana HandI teach Read 180 at Northwood Elementary School and I am passionate about reading (obviously!) In my "free time" I love hanging out with my 2 teenagers and taking our two dogs for long walks. Archives
March 2017
Categories |

 RSS Feed
